Show highlights
USGBC’s brand-new event, USGBC Live, combines the expertise of the largest community of green building leaders with the data, insights, stories, and leadership from the thousands of LEED and green building projects around the globe. Thank you to our sponsors and partners.
Attendees
Programming
What did you enjoy most at USGBC Live?
“I loved the variety of topics! And all kinds of information between sponsors and being able to contact the community.”
“Interacting with people from fairly diverse backgrounds.”
“Anytime Hub”
“Ease of platform and fantastic speakers.”
“Content very enjoyable. Still reeling from the kickoff speakers.”
Attendance by the numbers
68 countries represented
U.S. and regional channel attendees
Keynote speakers

Aaswath Raman
Assistant Professor, UCLA; Co-Founder and Chief Scientist, SkyCool Systems

Adam Grant
Organizational Psychologist, The Wharton School of Business; Bestselling Author; Host: WorkLife, a TED Original Podcast
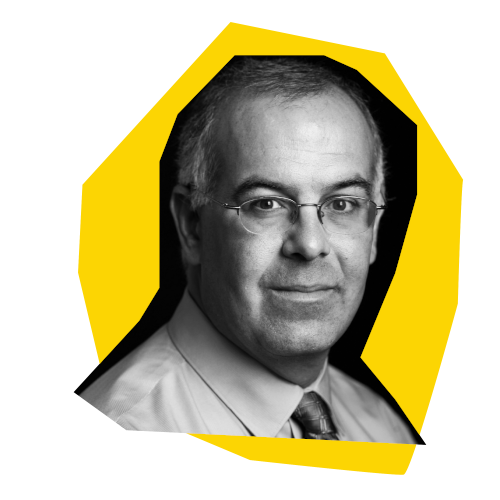
David Brooks
Author and New York Times Columnist
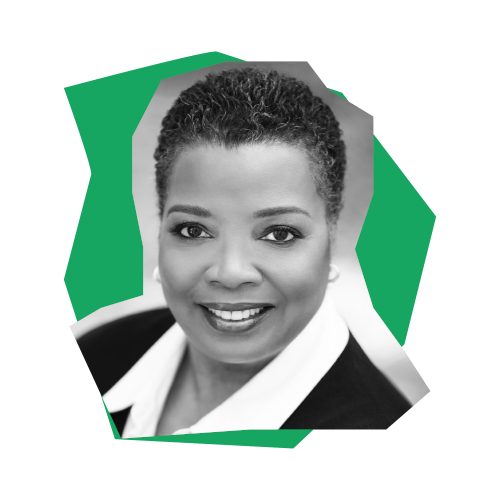
Deeohn Ferris, JD
President, Institute for Sustainable Communities

Gwen Migita
Vice President Social Impact, Sustainability, Diversity Equity & Inclusion
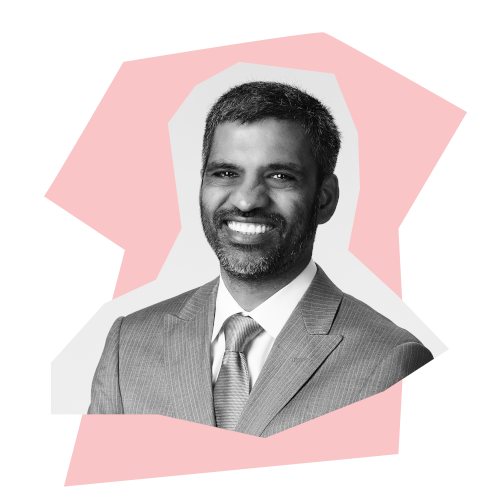
Mahesh Ramanujam
Former President and CEO, U.S. Green Building Council and Green Business Certification Inc.

Dr. Monica Araya
Clean Mobility Advocate, Adviser, Decarbonization Strategist
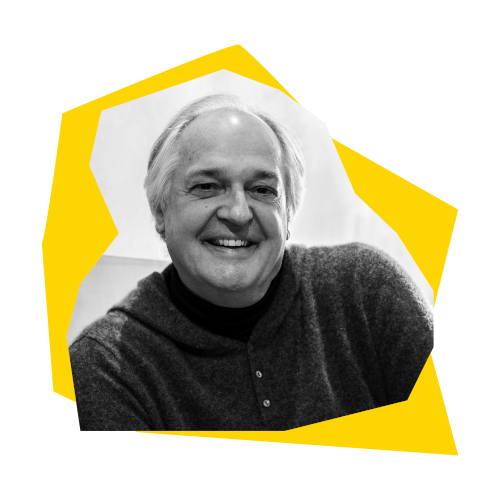
Paul Polman
Co-Founder and Co-Chair, IMAGINE
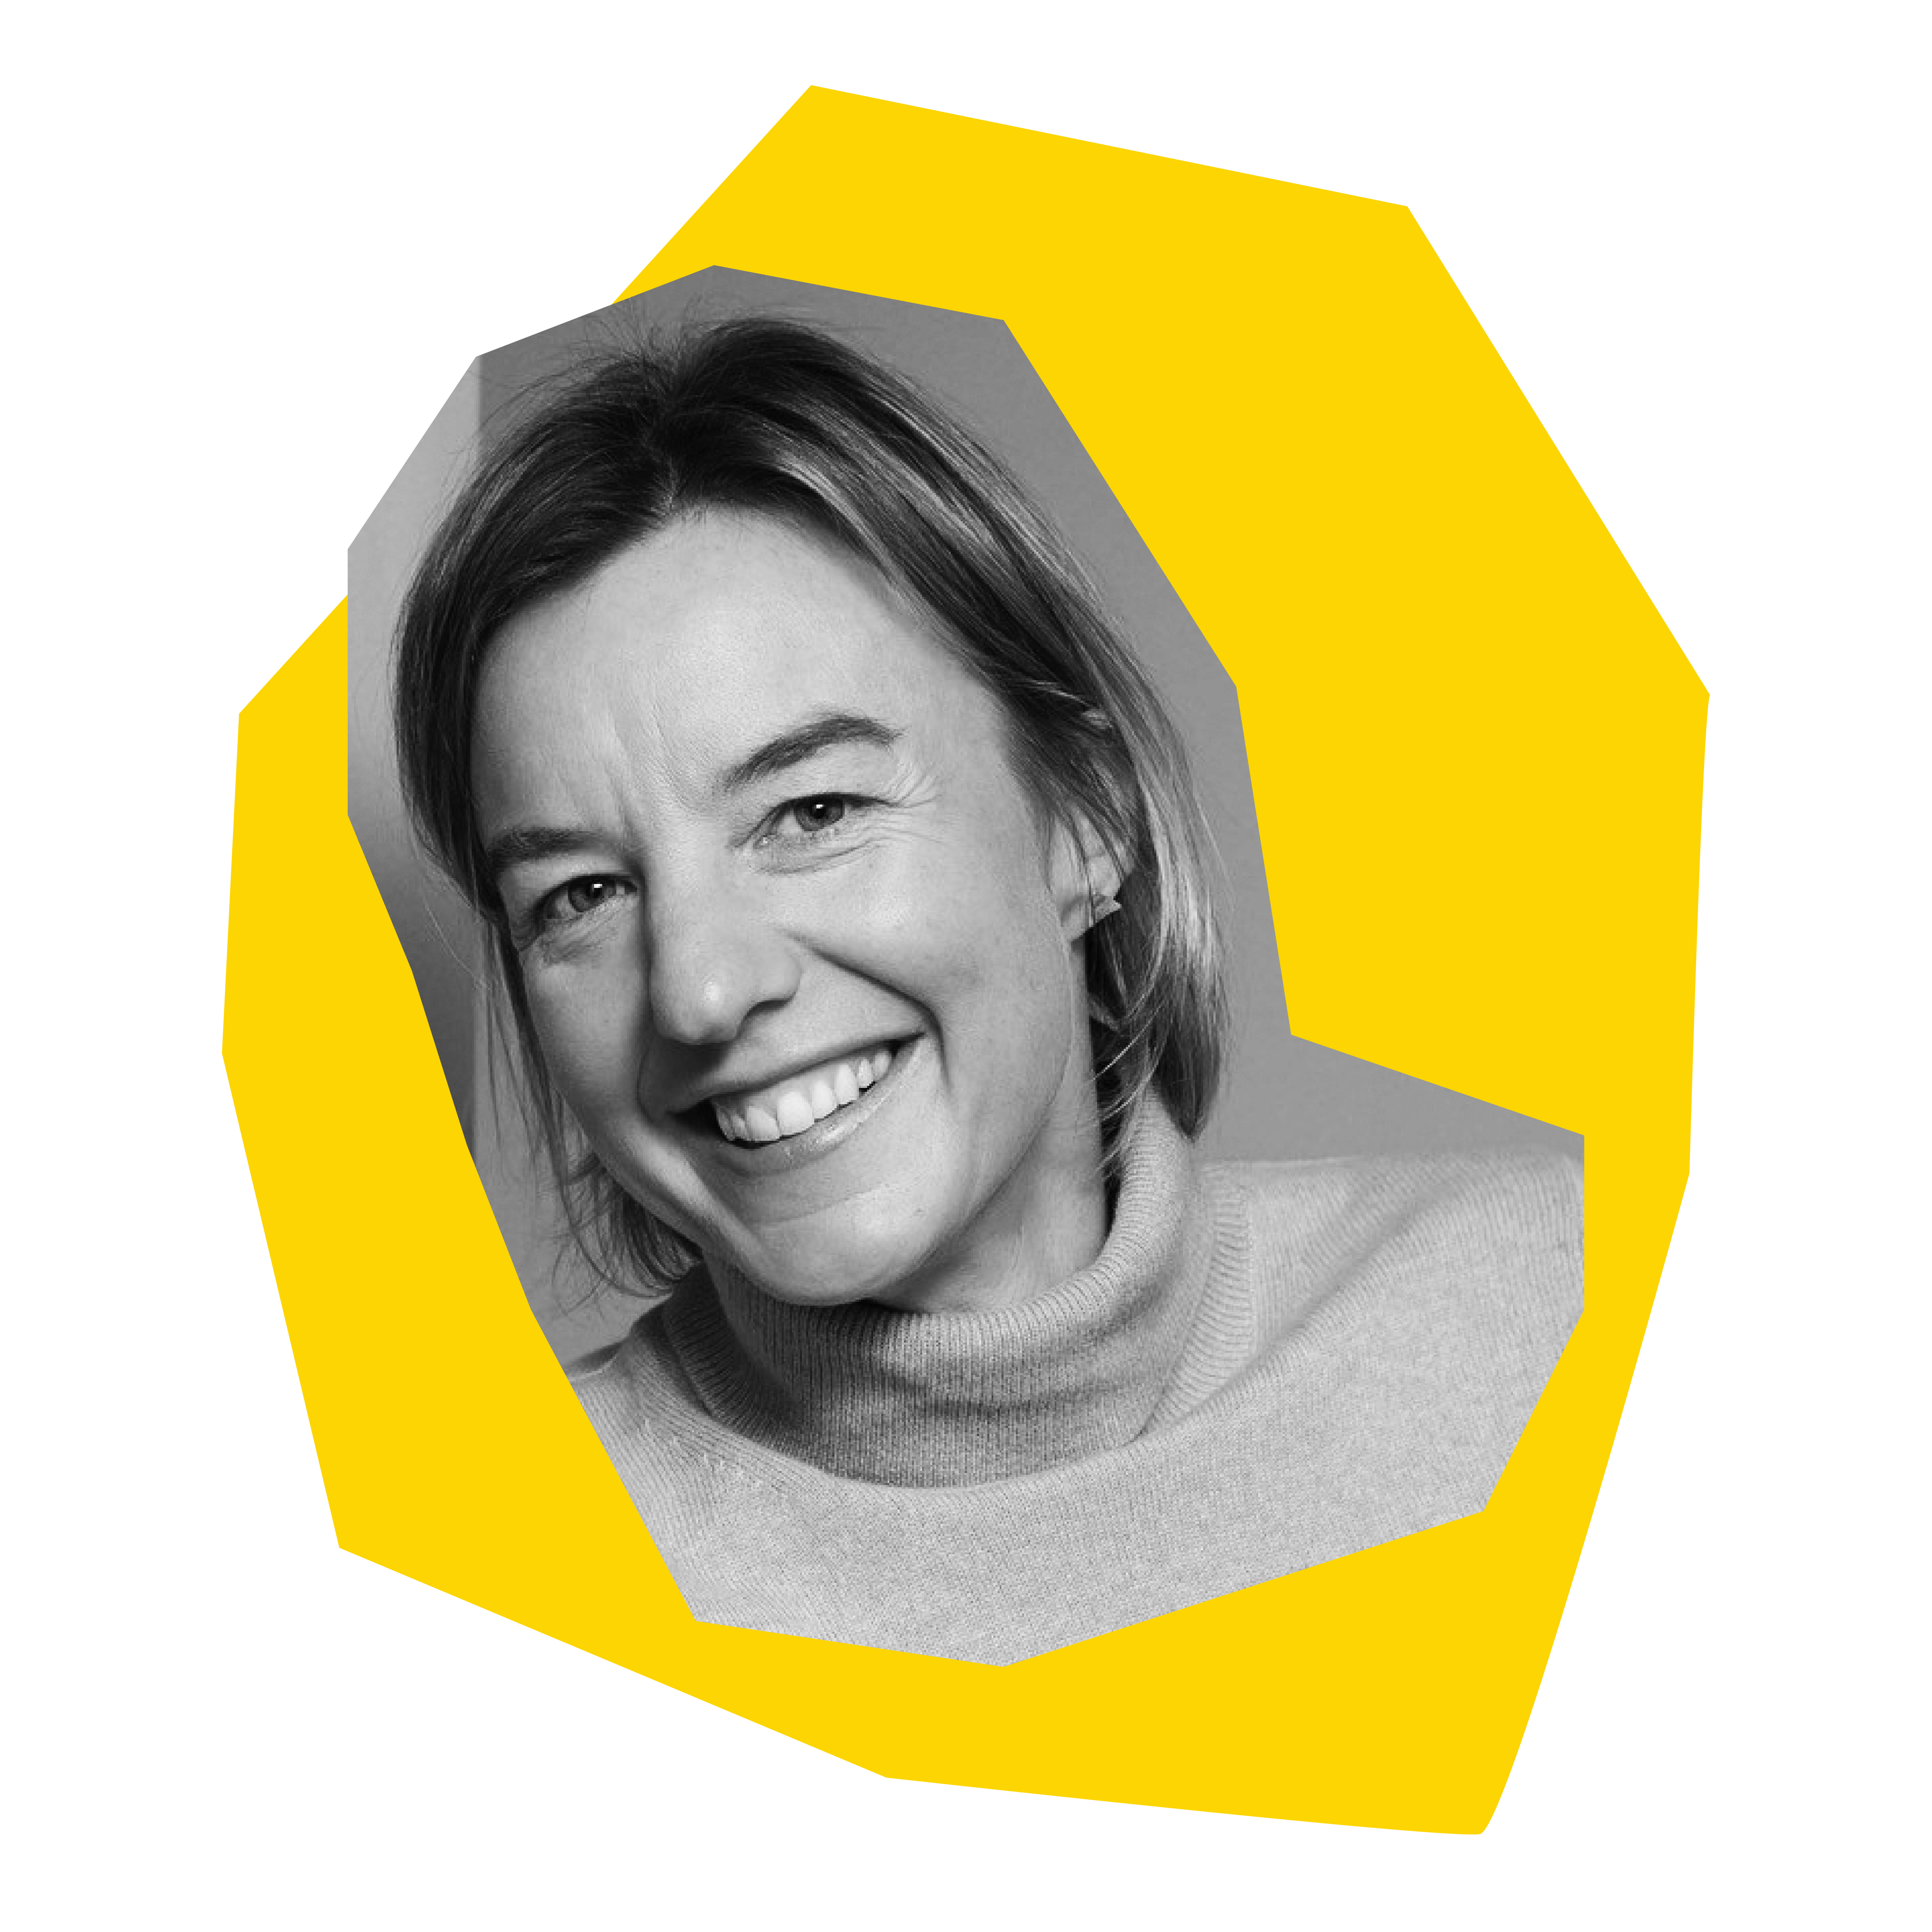
Dr. Tara Shine
Irish environmental scientist, policy advisor and science communicator

Tom Szaky
Founder and CEO, TerraCycle
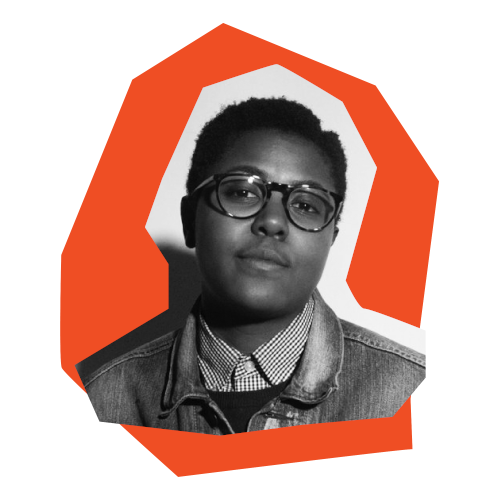
Vic Barrett
Climate Justice Activist
173 speakers from 17 countries
Event sustainability
USGBC is proud to operate our events in an environmentally sensitive manner. We have calculated and offset the emissions related to presenting this digital series, inclusive of streaming all live and on-demand education content, mobile app usage, and speaker and staff rehearsals. The equivalent of .153 metric tons of CO2 were offset through contributions to the Afognak Forest Carbon Project.
This carbon sequestration project reduces emissions and ensures the permanent protection of 8,219 acres of formerly logged, old-growth Sitka Spruce forests on the north coast of Afognak Island, Alaska. The use of federal and state conservation easements ensures that this land will be managed for conservation in perpetuity, even after the project’s 30-year crediting period elapses.
.153 metric tons of CO2 offset
Creating a new brand identity for USGBC Live
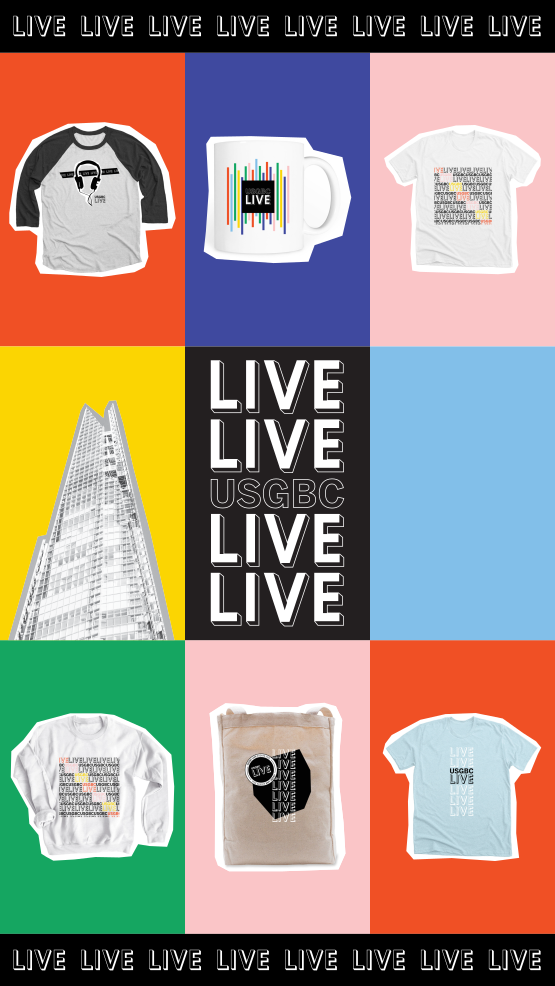
The newly minted USGBC Live brand was inspired by the ways we communicate and work, forever changed by the pandemic. We’re scrolling more, sharing links, jotting down ideas and Googling everything. The USGBC Live brand focuses on collage elements and layers of information. The look represents journal note-taking, ripped headlines, cutout photography and layers to create depth. Black-and-white photography creates the feel of newspapers and magazines.
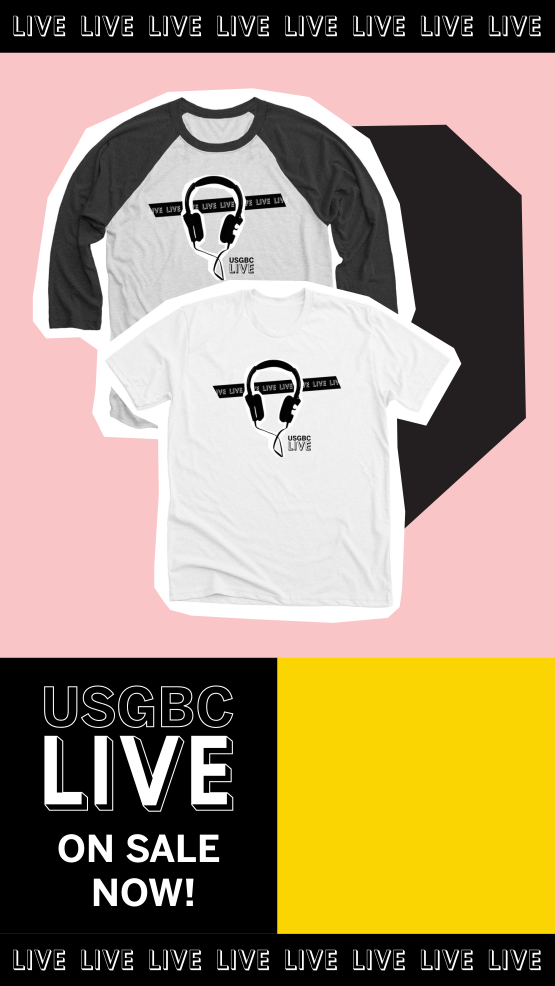
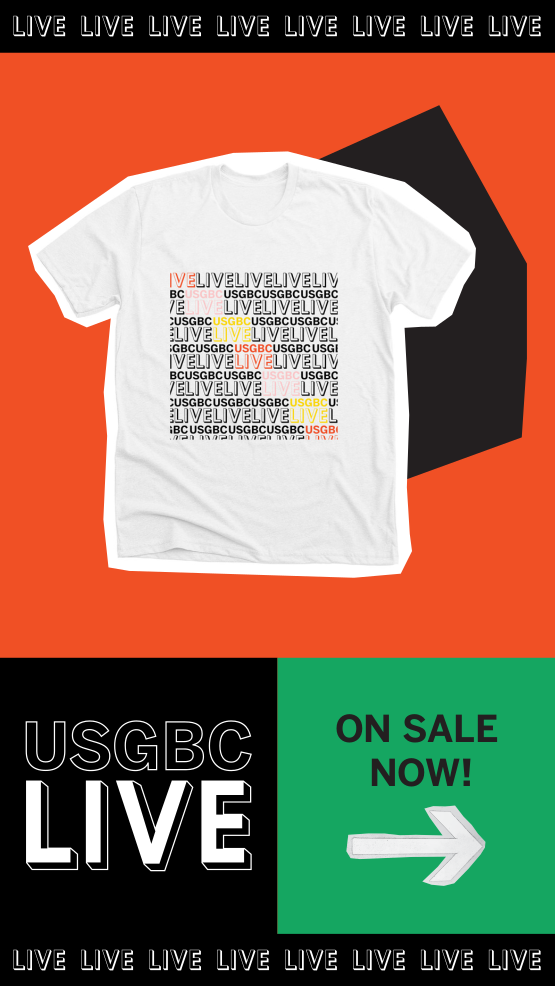
The brand experience is immersive and comes complete with a digital toolkit that offers web badges, social media graphics, Zoom backgrounds and commemorative merchandise to represent USGBC Live to an attendee. Digital events can feel isolating, but USGBC Live is designed to bring the green building community together—even if we can’t be together in person.

Digital marketing
USGBC Live was promoted from March-June 2021, through a comprehensive and coordinated effort across digital channels, including web, email, content marketing, social, and social advertising.
- Website: A new website was launched on March 15, 2021. To date, the website has generated 55,174 views with 26,662 users, and 2.07 views per user. The website featured articles, a dynamic agenda, an API-sourced sessions table, and a graphic, monthly sessions grid.
- Email: 32 emails were sent from March 16-June 10. Email was the biggest driver of user acquisition to usgbc-live.org.
- Content marketing: Content promoting the event was published from March 16-June 10. Content included 13 articles, 3 videos and 1 press release.
- Social: USGBC Live was promoted on LinkedIn, Twitter, Facebook and Instagram, with a total of 228 messages sent from March 15 to June 11. Messages generated 245,066 impressions, 1,949 engagements and 768 link clicks. The hashtag #USGBCLive21 was used by USGBC and attendees. From May 17 to June 12, the hashtag had a volume of 582, with 1,426 engagements, 1,043 likes, 19 comments, 364 shares, and 12,741,909 potential impressions. USGBC Live was also heavily promoted on Instagram using stories and reels, generating average impressions of 360 and an average reach of 350.
- Advertising: USGBC Live was promoted digitally in trade publications and online magazines including Metropolis, Architect, Dezeen and Frame. Display ads ran on websites including metropolis.com, architect.com, dezeen.com and frame.com, in newsletter placements and on their social media accounts. Ads ran in Dezeen, Frame, Metropolis, Architect from late March until June. Ads focused on driving registration and general event awareness.
Media and PR
Coverage of USGBC Live began to emerge in late March and began to pick up in early June before the conference began. It soared after the Leadership Awards were announced and peaked on June 14.
USGBC Live garnered a total of 207 media stories over a two-month period. The impact of the media coverage that was secured equaled an ad equivalency of more than $140,000. Most media stories were related to the Leadership Awards and the individual awardees, while other coverage focused on the event announcement ahead of the conference. The following is a sample of coverage:
- 2021 U.S. Green Building Council West North Central Region Leadership Award Recipients Announced
- Titan America Cements USGBC Leadership Award
- USGBC Announces Pacific Region Leadership Award Winners
- LG Captures 2021 USGBC Leadership Award for Outstanding Commitment to Advancing Green Building
- 2021 U.S. Green Building Council Mid-Atlantic and Northeast Region Leadership Award Recipients Announced
- St. Thomas Receives 2021 USGBC Leadership Award
- MARAEY conquista prêmio internacional
- USGBC Announces 2021 Leadership Awards
- Embassy Group receives U.S. Green Building Council (USGBC) Leadership Award for green building projects
- 2021 US Green Building Council India and SE Asia Leadership Award Recipients Announced
- June’s can’t-miss design events
- USGBC Live to Convene Green Building Council Community June 8 to 10
USGBC Live was an international event that and produced international media coverage. Nearly half of all coverage came mostly from trade and business media in North America, with a sizable amount of coverage coming from the Middle East and India and Southeast Asia. Some media in Europe and Latin America also produced stories.
- North America 47%
- Middle East 22%
- India and Southeast Asia 16%
- Europe 10%
- Latin America 2%
Media partnership
The media collaboration centered on magazines that projected upcoming breakthroughs in green design concepts, architecture, sustainable and alternative construction technologies, and catered to the needs of architects, designers, structural engineers, facility managers, builders, and developers, among others. There were 11 media partners from around the world, including the U.S., Mexico, India and the UK. The overall reach of the digital ads was 1 million+ impressions*. The approximate ad value of the barter media alliance was $9,500.
